import pandas as pd
import matplotlib.pyplot as plt
from matplotlib.table import Table
from matplotlib.patches import FancyArrowPatch
# 原始数据
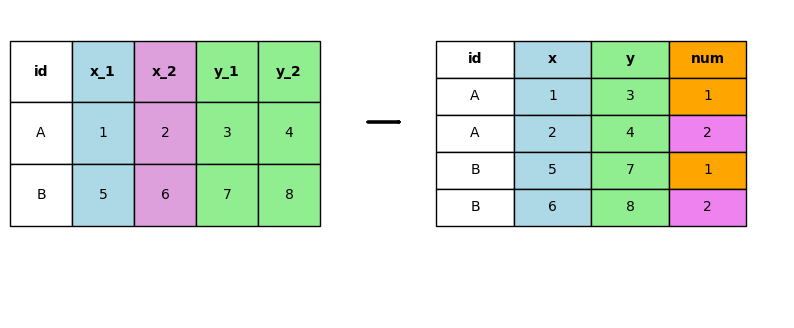
data1 = {
'id': ['A', 'B'],
'x_1': [1, 5],
'x_2': [2, 6],
'y_1': [3, 7],
'y_2': [4, 8]
}
df1 = pd.DataFrame(data1)
# 转换后数据
data2 = {
'id': ['A', 'A', 'B', 'B'],
'x': [1, 2, 5, 6],
'y': [3, 4, 7, 8],
'num': [1, 2, 1, 2]
}
df2 = pd.DataFrame(data2)
# 定义颜色映射
color_mapping = {
'x_1': 'lightblue',
'x_2': 'plum',
'y_1': 'lightgreen',
'y_2': 'lightgreen',
'x': 'lightblue',
'y': 'lightgreen',
'num': ['orange', 'violet']
}
# 创建图形和子图
fig, ax = plt.subplots(figsize=(10, 4))
ax.axis('off')
# 绘制原始表格
# 绘制原始表格
table1 = ax.table(
cellText=df1.values,
colLabels=df1.columns,
cellLoc='center',
loc='left',
bbox=[0, 0.3, 0.4, 0.6]
)
for (row, col), cell in table1.get_celld().items():
if row == 0:
cell.set_text_props(weight='bold')
if row > 0:
colname = df1.columns[col]
cell.set_facecolor(color_mapping.get(colname, 'white'))
else:
colname = df1.columns[col]
cell.set_facecolor(color_mapping.get(colname, 'white'))
# 绘制箭头
#ax.arrow(0.45, 0.6, 0.1, 0, head_width=0.03, head_length=0.05, fc='k', ec='k')
# 绘制转换后表格
table2 = ax.table(
cellText=df2.values,
colLabels=df2.columns,
cellLoc='center',
loc='right',
bbox=[0.55, 0.3, 0.4, 0.6]
)
for (row, col), cell in table2.get_celld().items():
if row == 0:
cell.set_text_props(weight='bold')
if row > 0:
colname = df2.columns[col]
if colname == 'num':
cell.set_facecolor(color_mapping['num'][(row-1) % 2])
else:
cell.set_facecolor(color_mapping.get(colname, 'white'))
else:
colname = df2.columns[col]
if colname == 'num':
cell.set_facecolor(color_mapping['num'][0])
else:
cell.set_facecolor(color_mapping.get(colname, 'white'))
# 添加 FancyArrowPatch 箭头以美化转换效果
fancy_arrow = FancyArrowPatch(
(0.48, 0.6), (0.52, 0.6),
transform=fig.transFigure,
connectionstyle="arc3,rad=0",
arrowstyle='-|>',
linewidth=2,
color='black'
)
fig.patches.append(fancy_arrow)
plt.show()